 |
Dolphin Sonar Signals: analysis of bottlenose dolphin
clicks
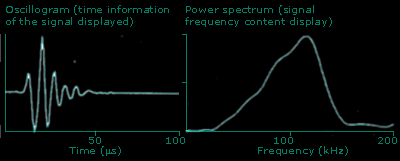
If you hook up your hydrophone to an oscilloscope, the dolphin clicks
would appear something like fig.1, the oscillogram,
which shows how the signal of a bottlenosed dolphin (Tursiops truncatus)
varies over time. It arrives suddenly, and fades away just as quickly,
lasting only a few cycles.
The timescale is in microseconds (millionths of a second), so the dolphin
click lasts less than 50 millionths of a second.

|
 |
When you analyse such a signal with Fourier
analysis, you get the power spectrum (fig. 2), which
shows which frequencies
present in the signal. The oscillogram and the power
spectrum are different ways of showing the characteristics
of the signal. The oscilloscope displays the signal's
time features and the power spectrum shows its frequency
features. Fourier analysis is usually an important
first step when invesitgating echolocating animals.
The signals are so short in duration though, that
modern, specialised methods are inceasingly being
used instead.
 |
 |
Fig.1
|
Fig.2
|
 |
